

See What Is Working and
Where to Improve Next.
Bring the reporting available from your connected services into a clearer view. Beesly Analytics helps you review activity, follow-up, and results so you can decide where to focus next.

The Scorecard: Sales & Pipeline Metrics
Your sales and operations view. Answer the practical question: how healthy is our recorded sales process?
Opportunity Value & Bottlenecks
Review the potential value associated with opportunities in your pipeline and spot where they tend to stall so you can address the cause.
Stage & Conversion Rates
See the percentage of recorded opportunities that move from one stage to the next, so you can identify the weakest link in your process.
Team Activity Report
Track recorded actions like calls made, texts sent, and emails replied to so you can see how your team is keeping up with activity.
The GPS: Attribution Reporting
Connect recorded results to the source of the activity so you can see what's driving opportunities and focus your effort where it counts. Attribution reflects the data and reporting rules available — it shows what's associated with an outcome, not complete proof of causation.
First Touch vs. Last Touch
See which recorded interaction first brought a contact in and which one was last associated with the outcome, based on the available attribution data.
Sources of Leads
Review a breakdown of where your recorded opportunities originate — such as organic search, social, or paid ads — to understand what's driving activity.

The Optimization Engine
Reporting is most useful when you act on it. Review what's happening, test changes, and measure the results so you can keep refining.
Connecting Ad Spend to Results
Go beyond cost per lead. Link recorded ad spend to outcomes like booked appointments or recorded sales, subject to the attribution data available.
Review, Refine, Repeat
Use available reporting to review weak points, test changes to your workflows, and measure the results so you can keep improving.
Dashboards by Role
Create tailored views for sales reps (activity), marketing managers (attribution), and executives (pipeline overview) based on the data connected.
Comprehensive Tracking
Review recorded interactions across your connected setup. From the first phone call to the final scheduled meeting, Beesly Analytics brings the available activity into one view.
Phone Call Metrics
Review answered calls, missed calls, call sources, and total call volume from your connected phone setup.
Meeting & Appointment Statistics
Monitor confirmed bookings, completed appointments, no-shows, and canceled meetings from your connected scheduling.
Reporting in One Place
Instead of pulling data from multiple tools, review what's available from your connected services in one organized view.
Campaign-Level Tracking
See which funnels, ads, and automations are associated with the most activity in your reporting.
Cross-Channel Reporting
Review performance across connected email, SMS, calls, and ads in one place.
Role-Specific Dashboards
Build tailored views so each person sees the information most relevant to their work.
Up-to-Date Activity
Review campaign activity as it's recorded, rather than piecing it together from separate tools.
Metrics That Help You Decide
Not all metrics are created equal. Some numbers look impressive but don't help you decide what to do next. Tracking these in Beesly Analytics helps you focus on measures tied to real activity and outcomes — with their meaning kept accurate.
Lead Conversion Rate
How many recorded leads are moving toward a recorded outcome?
Cost Per Lead (CPL)
Track your acquisition cost based on recorded spend and lead volume.
Customer Lifetime Value
Review the value associated with customers over time, based on the data available.
Pipeline Value
See the potential value currently associated with your active opportunities — not earned revenue.
Response Rate
Review whether your automations and follow-ups are driving the engagement you expect.
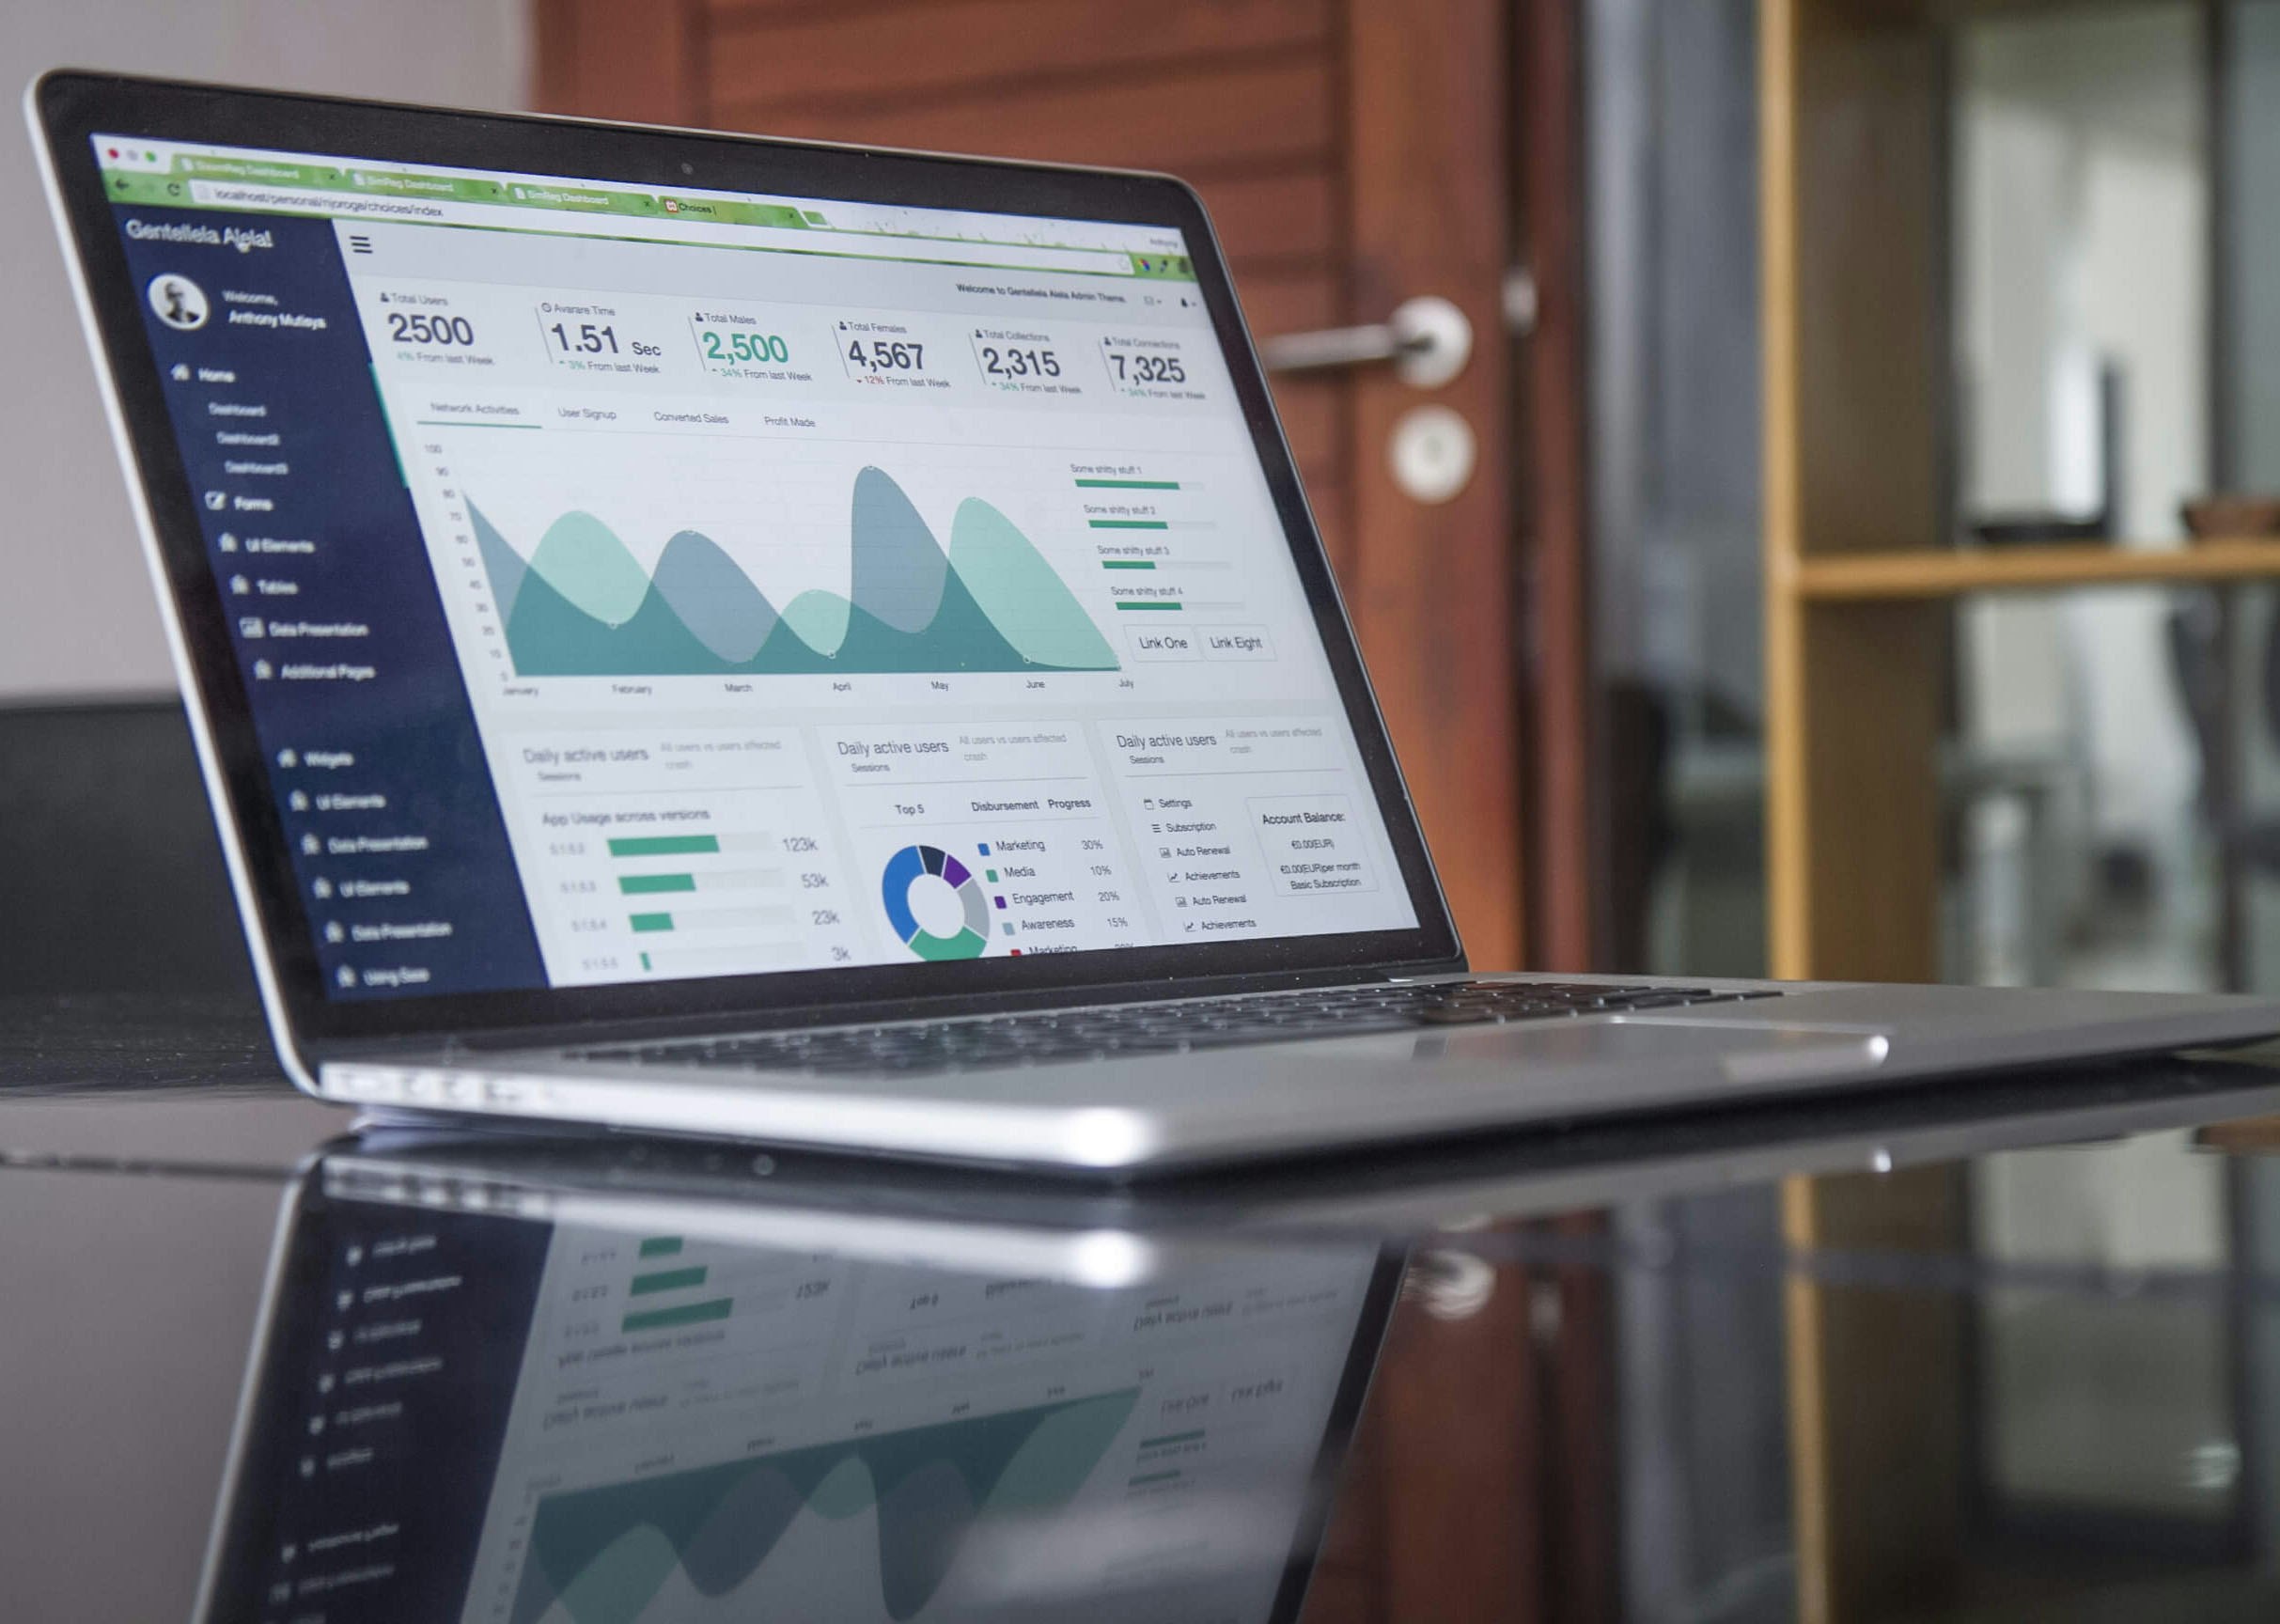
Reporting With a Clearer Purpose
We help identify the measures relevant to your goals and the information available from your setup. Your agreed service defines how reporting is configured and whether ongoing review or recommendations are included.
Analytics supports decisions across visibility, trust, conversion, and follow-up — helping you see what's happening and where to improve next.
Know What to Review Next
Let's identify the information your business needs, what your current systems can provide, and how to make the reporting easier to use.